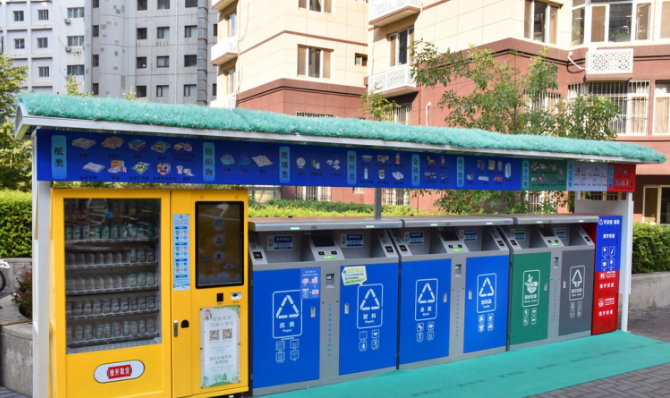
全球人均垃圾产量排行榜出炉 加拿大居首
全球人均垃圾产量排行榜出炉 加拿大居首

The world is drowning in trash, and the waste generation rates are only increasing, according to the World Bank. Due to population growth and urban areas growth, the amount of trash countries produce is only expected to rise—by some estimates as much as 70% between 2016 & 2050.
While much of the focus is on individuals and families and the amount of trash they generate, residential trash is only a fraction of the garbage produced by certain industries. Between 30% and 35% of the total amount of generated waste in most developed countries is attributed to building sector activities such as building construction, renovation, and demolition processes, according to the official EU statistical data. In many countries on our list, the construction industry is often the largest culprit(罪魁祸首), generating more than 90% of the total waste produced in a country. China is a notable exception, where more than half of the waste is agricultural or industrial.
Many countries have recognized the importance of properly and safely disposing of trash and have passed laws regulating how cities and corporations get rid of the waste they are producing. Some developing countries are struggling because governments often lack the funding to solve waste management challenges. Many are focusing on advocating recycling. In the United States, for example, some states will even pay you to recycle.
To identify the largest producers of waste, Tempo calculated the special waste and regular municipal solid waste per capita produced by each country, using data from the World Bank’s “What a Waste” global database, last updated in September of 2018. Among the top 10 countries in the world in terms of per capita garbage output calculated from the database, Canada, on the top list, has 36.1 metric tons of estimated annual waste per capita and 1,325,480,289 metric tons of estimated annual waste total. Bulgaria is on the second list with 26.7 metric tons of estimated annual waste per capita and 189,141,945 metric tons of estimated annual waste total. The United States ranks the third with 25.9 metric tons of estimated annual waste per capita and 8,425,840,000 metric tons of estimated annual waste total.  

本时文内容由奇速英语国际教育研究院原创编写,未经书面授权,禁止复制和任何商业用途,版权所有,侵权必究!(作者投稿及时文阅读定制请联系微信:400-1000-028)

1.Why is the amount of trash countries produce expected to rise?

A Because of the growth of population and urban areas.

B Because of a large amount of trash in developed countries.

C Because of a large amount of trash in developing countries.

D Because of the increasing amount of trash families and individuals generate.

解析:选A。细节理解题。根据第一段Due to population growth and urban areas growth, the amount of trash countries produce is only expected to rise可知,由于人口增长和城市地区的增长,预计垃圾国家产生的数量只会增加,故选A。

2.In developed countries, 30% to 35% of the generated waste includes the following EXCEPT______.

A building construction

B renovation

C demolition processes

D residential trash

解析:选D。细节理解题。根据第二段residential trash is only a fraction of the garbage produced by certain industries.和Between 30% and 35% of the total amount of generated waste in most developed countries is attributed to building sector activities such as building construction, renovation, and demolition processes可知,在大多数发达国家,30%至35%的垃圾来自建筑行业活动中的建筑施工、翻新和拆除过程,并不是来自居民垃圾,故选D。

3.What can we infer from the third paragraph?

A Many countries know the importance of properly and safely disposing of trash.

B Many developing countries are focusing on advocating recycling.

C Many countries face challenges to dispose trash properly and safely.

D Some states in the United States will even pay residents to recycle.

解析:选C。推理判断题。根据第三段的内容可以推出很多国家在处理垃圾上都面临很多挑战,不管是发展中国家还是发达中国家,故选C。

4.What is the main idea of the last paragraph?

A Garbage classification.

B Ranking of garbage survey.

C Waste recovery and utilization.

D Garbage disposal in different countries.

解析:选B。主旨大意题。最后一段是一份关于各个国家的垃圾数量调查排名报告,故选B。